
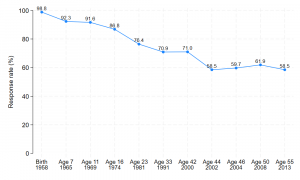
The table below presents statistics about response in NCDS at every major sweep from birth.
Of the 17,415 cohort members who participated in the first sweep, 4,497 (25.8%) have participated in all 11 major sweeps.
Of all 18,558 cohort members, 12,505 (67.4%) have taken part in at least half the sweeps (six or more sweeps).
| Total cohort | Dead | Emigrants | Eligible sample | Participants | (% of eligible sample) | |
| Birth – 1958 | 17,633 | 0 | 0 | 17,633 | 17,415 | 98.8 |
| Age 7 – 1965 | 18,010a | 821 | 475 | 16,714 | 15,425 | 92.3 |
| Age 11 – 1969 | 18,283a | 840 | 701 | 16,742 | 15,337 | 91.6 |
| Age 16 – 1974 | 18,558a | 873 | 799 | 16,886 | 14,654 | 86.8 |
| Age 23 – 1981 | 18,558 | 960 | 1,196 | 16,402 | 12,537 | 76.4 |
| Age 33 – 1991 | 18,558 | 1,049 | 1,335 | 16,174 | 11,469 | 70.9 |
| Age 42 – 2000 | 18,558 | 1,199 | 1,268 | 16,091 | 11,419 | 71.0 |
| Age 44 – 2002 | 18,558 | 1,286 | 1,236 | 16,036 | 9,377 | 58.5 |
| Age 46 – 2004 | 18,558 | 1,323 | 1,272 | 15,963 | 9,534 | 59.7 |
| Age 50 – 2008 | 18,558 | 1,459 | 1,293 | 15,806 | 9,790 | 61.9 |
| Age 55 – 2013 | 18,558 | 1,659 | 1,286 | 15,613 | 9,137 | 58.5 |
a The original sample was supplemented by migrants born in 1958
We have used a systematic data-driven approach to identify variables that are important predictors of non-response at each NCDS sweep, between age seven and age 55. Future work will extend this analysis to include non-response at the age 62 sweep.
A list of these variables is provided in the appendix of the Handling missing data in the CLS cohort studies user guide.
These variables can then be considered for inclusion in analyses – for example as auxiliary variable when using multiple imputation – in order to maximise the plausibility of the missing at random (MAR) assumption.
Read more about the process in the article: Missing at random assumption made more plausible: evidence from the 1958 British birth cohort.
We have been able to restore the composition of the NCDS samples at ages 50 and 55 to be more representative of the study’s target population. We did this by including predictors of non-response at age 50 and age 55 as auxiliary variables in multiple imputation analyses.
For example, we were able to replicate:
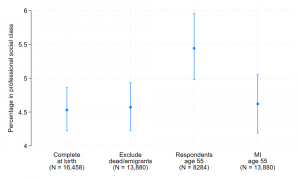
The imputation phase of this analysis included predictors of non-response at age 55 and social class at birth only for cohort members that participated at age 55.
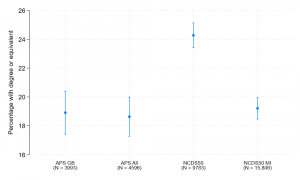
APS GB: Annual Population Survey = Born in Great Britain in 1958, derived by the Office for National Statistics (ONS)
APS All: Annual Population Survey = Born in Great Britain or elsewhere in 1958 (derived by ONS)
NCDS50 MI: Estimate after multiple imputation using predictors of educational attainment at age 50 and predictors of non-response at age 50 as auxiliary variables.
Find out more about the approaches that CLS recommends for the handling of missing data, and resources available, on the Handling missing data page.
Find the latest developments and insights from across all our longitudinal studies.
The CLS Bibliography is a searchable database of published work based on our cohort studies. Search by keyword, author, date range and journal.
Data from our studies are mainly available through the UK Data Service. We run training to support researchers who are interested in using our studies in their work.
Centre for Longitudinal Studies
UCL Social Research Institute
20 Bedford Way
London WC1H 0AL
Email: clsdata@ucl.ac.uk

 Our studies