On this page:
Find out more about the level of response for every sweep of the 1970 British Cohort Study (BCS70), important predictors of non-response, and how to handle missing data in the study.
As of August 2026:
| Total cohort | Dead | Emigrants | Eligible sample | Participants | (% of eligible sample) | |
| Birth – 1970 | 16,606 | 0 | 0 | 16,606 | 16,589 | 99.9 |
| Age 5 – 1975 | 16,959a | 567 | 0 | 16,392 | 13,135 | 80.1 |
| Age 10 – 1980 | 17,799a | 589 | 0 | 17,210 | 14,870 | 86.4 |
| Age 16 – 1986 | 18,038a | 622 | 0 | 17,416 | 11,615 | 66.7 |
| Age 26 – 1996 | 18,038 | 716 | 35 | 17,287 | 9,003 | 52.1 |
| Age 30 – 2000 | 18,038 | 766 | 235 | 17,037 | 11,261 | 66.1 |
| Age 34 – 2004 | 18,038 | 819 | 432 | 16,787 | 9,665 | 57.6 |
| Age 38 – 2008 | 18,038 | 881 | 456 | 16,701 | 8,874 | 53.1 |
| Age 42 – 2012 | 18,038 | 965 | 433 | 16,640 | 9,841 | 59.1 |
| Age 46 – 2016 | 18,038 | 985 | 466 | 16,587 | 8,581 | 51.7 |
| Age 51 – 2021 | 18,038 | 1,047 | 242 | 16,749 | 8,016 | 47.9 |
a The original sample was supplemented by migrants born in 1970.
Missing data are common in surveys and cohort studies. To tackle this in BCS70, we have used a systematic data-driven approach to identify variables that are important predictors of non-response at each sweep.
These variables can then be considered for inclusion in analyses – for example as auxiliary variable when using multiple imputation – in order to maximise the plausibility of the missing at random (MAR) assumption.
Find a list of these variables for BCS70 sweeps between age 5 and age 46 in the appendix of the Handling missing data in the CLS cohort studies user guide.
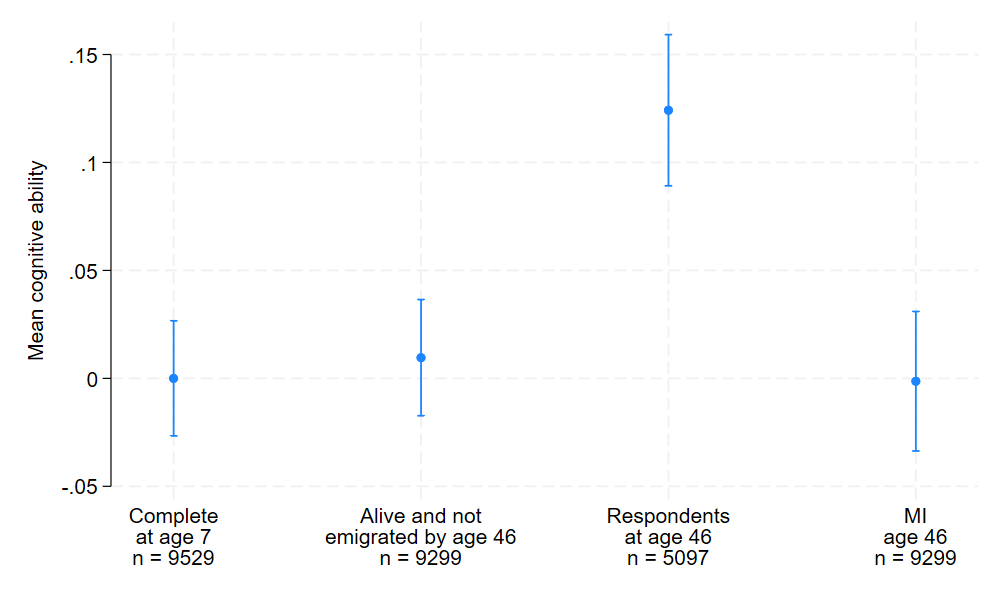
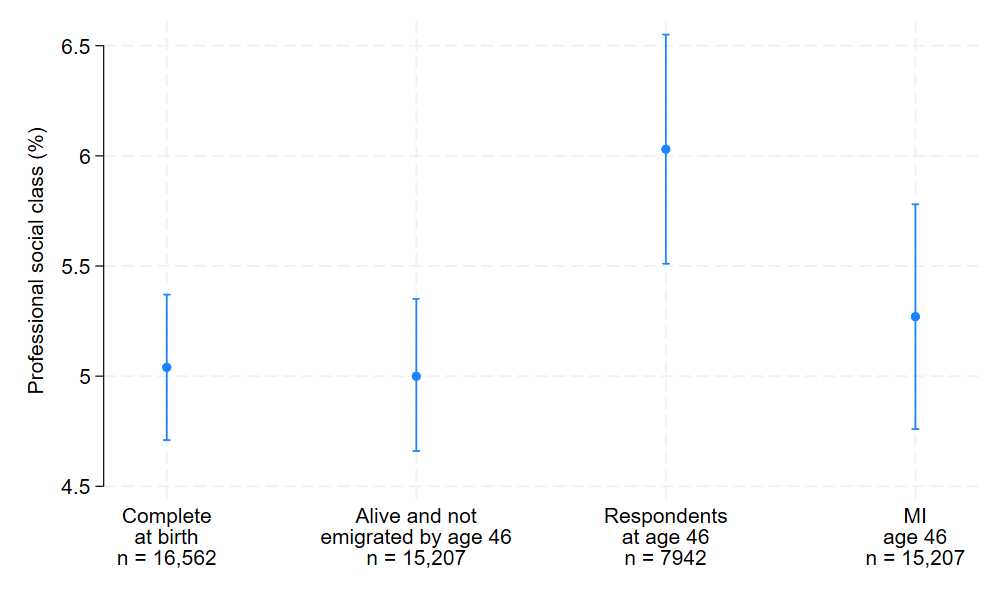
We were able to restore the composition of the BCS70 sample at age 46 to be more representative of the study’s target population. We did this by including predictors of non-response at age 46 as auxiliary variables in multiple imputation analyses.
For example, we were able to replicate:
The imputation phase of this analysis included predictors of non-response at age 46 and social class at birth only for cohort members that participated at age 46.
The imputation phase of this analysis included predictors of non-response at age 46 and cognitive ability at age 5 only for cohort members that participated at age 46.
A data-driven approach to address missing data in the 1970 British birth cohort
BMC Medical Research Methodology
How to mitigate selection bias in COVID-19 surveys: evidence from five national cohorts
European Journal of Epidemiology

Find out more about the approaches that CLS recommends for the handling of missing data, and resources available, on the Handling missing data programme page.