On this page:
Find out more about the level of response for every sweep of the 1958 National Child Development Study, important predictors of non-response, and how to handle missing data in the study.
As of September 2026:
The table below presents statistics about response in NCDS at every major sweep from birth.
| Total cohort | Dead | Emigrants | Eligible sample | Participants | (% of eligible sample) | |
| Birth – 1958 | 17,633 | 0 | 0 | 17,633 | 17,415 | 98.8 |
| Age 7 – 1965 | 18,010a | 821 | 475 | 16,714 | 15,425 | 92.3 |
| Age 11 – 1969 | 18,283a | 840 | 701 | 16,742 | 15,337 | 91.6 |
| Age 16 – 1974 | 18,558a | 873 | 799 | 16,886 | 14,654 | 86.8 |
| Age 23 – 1981 | 18,558 | 960 | 1,196 | 16,402 | 12,537 | 76.4 |
| Age 33 – 1991 | 18,558 | 1,049 | 1,335 | 16,174 | 11,469 | 70.9 |
| Age 42 – 2000 | 18,558 | 1,199 | 1,268 | 16,091 | 11,419 | 71.0 |
| Age 44 – 2002 | 18,558 | 1,286 | 1,236 | 16,036 | 9,377 | 58.5 |
| Age 46 – 2004 | 18,558 | 1,323 | 1,272 | 15,963 | 9,534 | 59.7 |
| Age 50 – 2008 | 18,558 | 1,459 | 1,293 | 15,806 | 9,790 | 61.9 |
| Age 55 – 2013 | 18,558 | 1,659 | 1,286 | 15,613 | 9,137 | 58.5 |
| Age 62 – 2020 | 18,558 | 2,447 | 1,526b | 14,585b | 8,215b | 56.3 |
a At ages 7, 11 and 16, the original sample was supplemented by migrants born in 1958.
b At age 62, 327 cohort members known to be living outside of Great Britain (emigrant cases) were invited to take part in the mop-up web survey, of whom 190 responded. Such emigrants are not formally considered as part of the NCDS target population, so to maintain consistency with earlier sweeps they have been considered as ineligible in these calculations (and those preceding the table), though their data are available for analysis.
Missing data are common in surveys and cohort studies. To tackle this in NCDS, we have used a systematic data-driven approach to identify variables that are important predictors of non-response at each sweep.
We have used a systematic data-driven approach to identify variables that are important predictors of non-response at each NCDS sweep, between age seven and age 55. Future work will extend this analysis to include non-response at the age 62 sweep.
A list of these variables is provided in the appendix of the Handling missing data in the CLS cohort studies user guide.
These variables can then be considered for inclusion in analyses – for example as auxiliary variable when using multiple imputation – in order to maximise the plausibility of the missing at random (MAR) assumption.
Read more about the process in the article: Missing at random assumption made more plausible: evidence from the 1958 British birth cohort.
We have been able to restore the composition of the NCDS samples at ages 50 and 55 to be more representative of the study’s target population. We did this by including predictors of non-response at age 50 and age 55 as auxiliary variables in multiple imputation analyses.
For example, we were able to replicate:
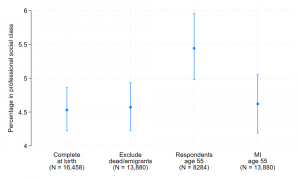
The imputation phase of this analysis included predictors of non-response at age 55 and social class at birth only for cohort members that participated at age 55.
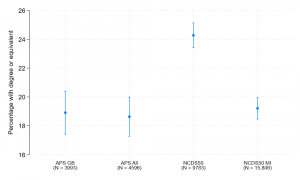
APS GB: Annual Population Survey = Born in Great Britain in 1958, derived by the Office for National Statistics (ONS)
APS All: Annual Population Survey = Born in Great Britain or elsewhere in 1958 (derived by ONS)
NCDS50 MI: Estimate after multiple imputation using predictors of educational attainment at age 50 and predictors of non-response at age 50 as auxiliary variables.
How to mitigate selection bias in COVID-19 surveys: evidence from five national cohorts
European Journal of Epidemiology
Using linked administrative data to aid the handling of non-response and restore sample representativeness in cohort studies
BMC Medical Research Methodology
Letter to the editor: Don’t forget survey data: ‘healthy cohorts’ are ‘real-world’ relevant if missing data are handled appropriately
Longitudinal and Life Course Studies
Missing at random assumption made more plausible: evidence from the 1958 British birth cohort
Journal of Clinical Epidemiology

Find out more about the approaches that CLS recommends for the handling of missing data, and resources available, on the Handling missing data programme page.