
The table below presents statistics about response in the NCDS at every major sweep from birth. Take a look at our guidance for advice on handling missing data and restoring sample representativeness.
Of the 17,415 cohort members who participated in the first sweep, 4,497 (25.8%) have participated in all 11 sweeps. Of all 18,558 cohort members, 11,232 (60.5%) have taken part in 7 or more sweeps.
Table. Participation in the NCDS from birth to 55 years
| Total cohort | Dead | Emigrants | Eligible sample | Participants | (% of eligible sample) | |
| Birth – 1958 | 17638 | 0 | 0 | 17638 | 17415 | 98.7 |
| Age 7 – 1965 | 18016a | 821 | 475 | 16720 | 15425 | 92.3 |
| Age 11 – 1969 | 18287a | 840 | 701 | 16746 | 15337 | 91.6 |
| Age 16 – 1974 | 18558a | 873 | 799 | 16886 | 14654 | 86.8 |
| Age 23 – 1981 | 18558 | 960 | 1196 | 16402 | 12357 | 75.3 |
| Age 33 – 1991 | 18558 | 1049 | 1335 | 16174 | 11469 | 70.9 |
| Age 42 – 2000 | 18558 | 1199 | 1268 | 16091 | 11419 | 71.0 |
| Age 44 – 2002 | 18558 | 1321 | 1234 | 16003 | 9377 | 58.6 |
| Age 46 – 2004 | 18558 | 1323 | 1272 | 15963 | 9534 | 59.7 |
| Age 50 – 2008 | 18558 | 1459 | 1293 | 15806 | 9790 | 61.9 |
| Age 55 – 2013 | 18558 | 1659 | 1286 | 15613 | 9137 | 58.5 |
a The original sample was supplemented by migrants born in 1958
Different types of people tend to drop out of our studies at different times, depending on their individual circumstances and characteristics.
To support researchers in producing robust analysis, we have developed comprehensive advice on how to deal with missing data.
The approaches we recommend to researchers capitalise on the rich data cohort members provided over the years before their non-response. These include well known methods such as multiple imputation, inverse probability weighting, and full information maximum likelihood.
Guidance on how users can adopt these methods for handling missing data in NCDS in their own analyses is available in our NCDS Missing Data User Guide.
We also offer training on handling missing data. Please keep an eye on our events page for details of future training. Or get in touch with us at ioe.clsevents@ucl.ac.uk.
In Mostafa et al[1], we show that the methods we recommend are able to restore the composition of the National Child Development Study (NCDS) samples at age 50 and age 55 to be representative of the study’s target population. For example, we were able to replicate the original distribution of paternal social class observed at the birth survey (see figure below), as well as the distribution of cognitive ability at age 7, and the known population distribution of educational attainment and marital status at age 50.
For further details, please see the resources on this website on handling missing data in all the CLS cohort studies.
Figure. Social class of mother’s husband at birth before and after adjustment for missing data.
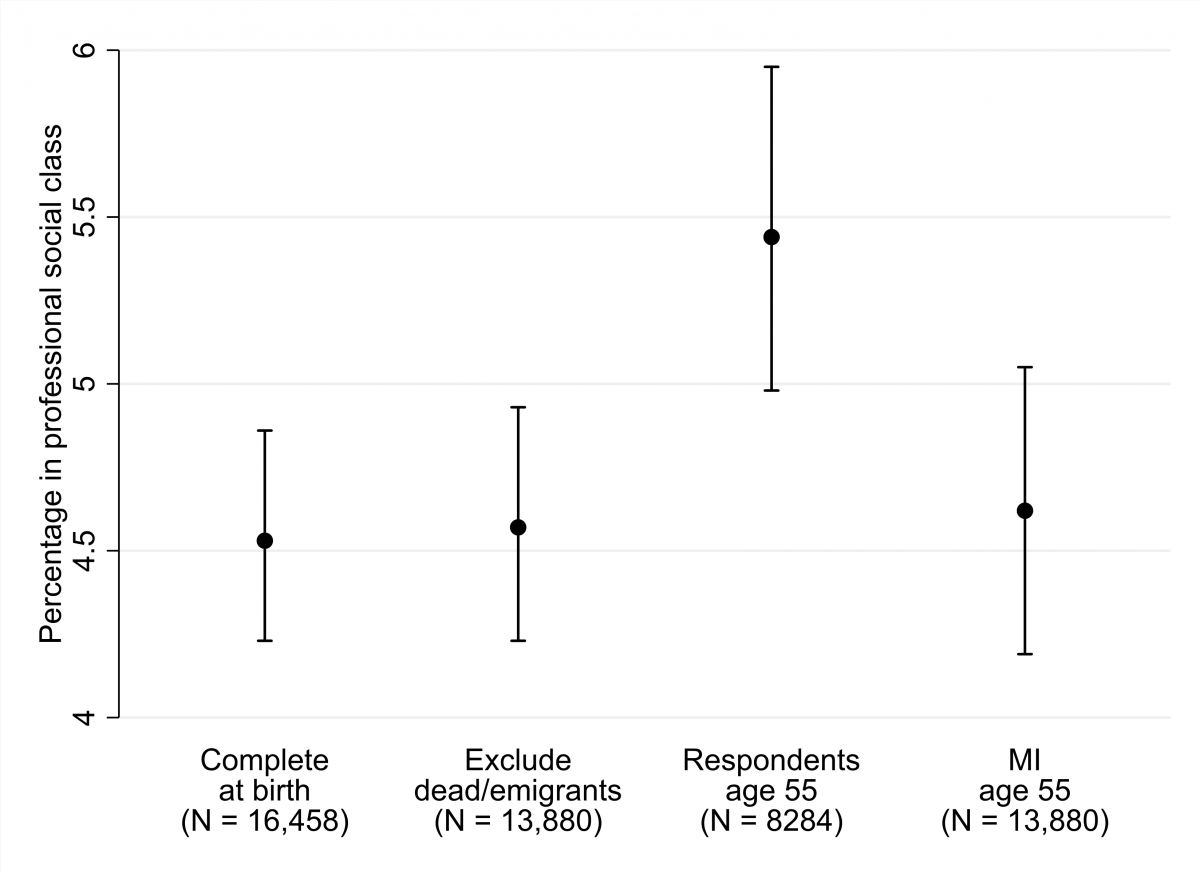
Imputation phase of MI included predictors of response at age 55 and social class at birth only for cohort members that participated at age 55.
References
[1] Mostafa, T., Narayanan, M., Pongiglione, B., Dodgeon, B., Goodman, A., Silverwood, R.J., and Ploubidis, G.B. (2020) Improving the plausibility of the missing at random assumption in the 1958 British birth cohort: A pragmatic data driven approach, CLS Working Paper 2020/6. London: UCL Centre for Longitudinal Studies.
Find the latest developments and insights from across all our longitudinal studies.
Our bibliography is a searchable database of published work based on our cohort studies. Search by keyword, author, date range and journal.
Data from our studies are mainly available through the UK Data Service. We run training to support researchers who are interested in using our studies in their work.
Centre for Longitudinal Studies
UCL Social Research Institute
20 Bedford Way
London WC1H 0AL
Email: clsdata@ucl.ac.uk


 Our studies